
Thanks for taking an interest in BESSi.
You found us at RE+ — or someone handed you one of our cards. Tell us a little about your fleet and we'll set up a walkthrough on your own sites: the revenue outlook, the Performance Score, and the string-level health your OEM stack doesn't report.
Thank you — we'll be in touch.
Your details are with the BESSi team. Expect a note from us within two business days to find a time to walk through your fleet. In the meantime, bessi.energy has the full story.
- Read-only by architecture — never writes to BMS, PCS, or EMS.
- Owner-controlled historian — your data, beyond OEM retention windows.
- PJM-native — Manual 12 Performance Score methodology.
- No slideware, no obligation — live dashboards on your own sites.
Prefer email? connect@medullus.com · (732) 800-6030
Five answers every battery fleet needs.
BESSi grew up on a working PJM frequency-regulation fleet — four sites, 89 containers — where it found trip precursors and revenue answers the vendor stack could not.
Predictmarket revenue
Regulation revenue forecasts at 1-, 4-, and 24-hour horizons, plus the hours most likely to spike — anchored to the clearing prices and PJM Manual 12 methodology the market uses to pay you.
Validateperformance
An independent 100-hour Performance Score, reconciled against your provider's number, with commanded-versus-delivered divergence found and explained when it slips.
Monitorasset health
Fleet, site, container and string views; thermal outliers against the fleet band; decoded alarms with the trip replayed to the second and causes ranked.
Explainevery number
No black-box KPIs. Every prediction ships with contributing variables, a confidence score and plain-language reasoning — and you can ask any chart why.
Analyzehistorical data
A permanent historian in your own cloud tenant, beyond OEM retention windows — so degradation, capacity tests and disputes are answerable from data you own.
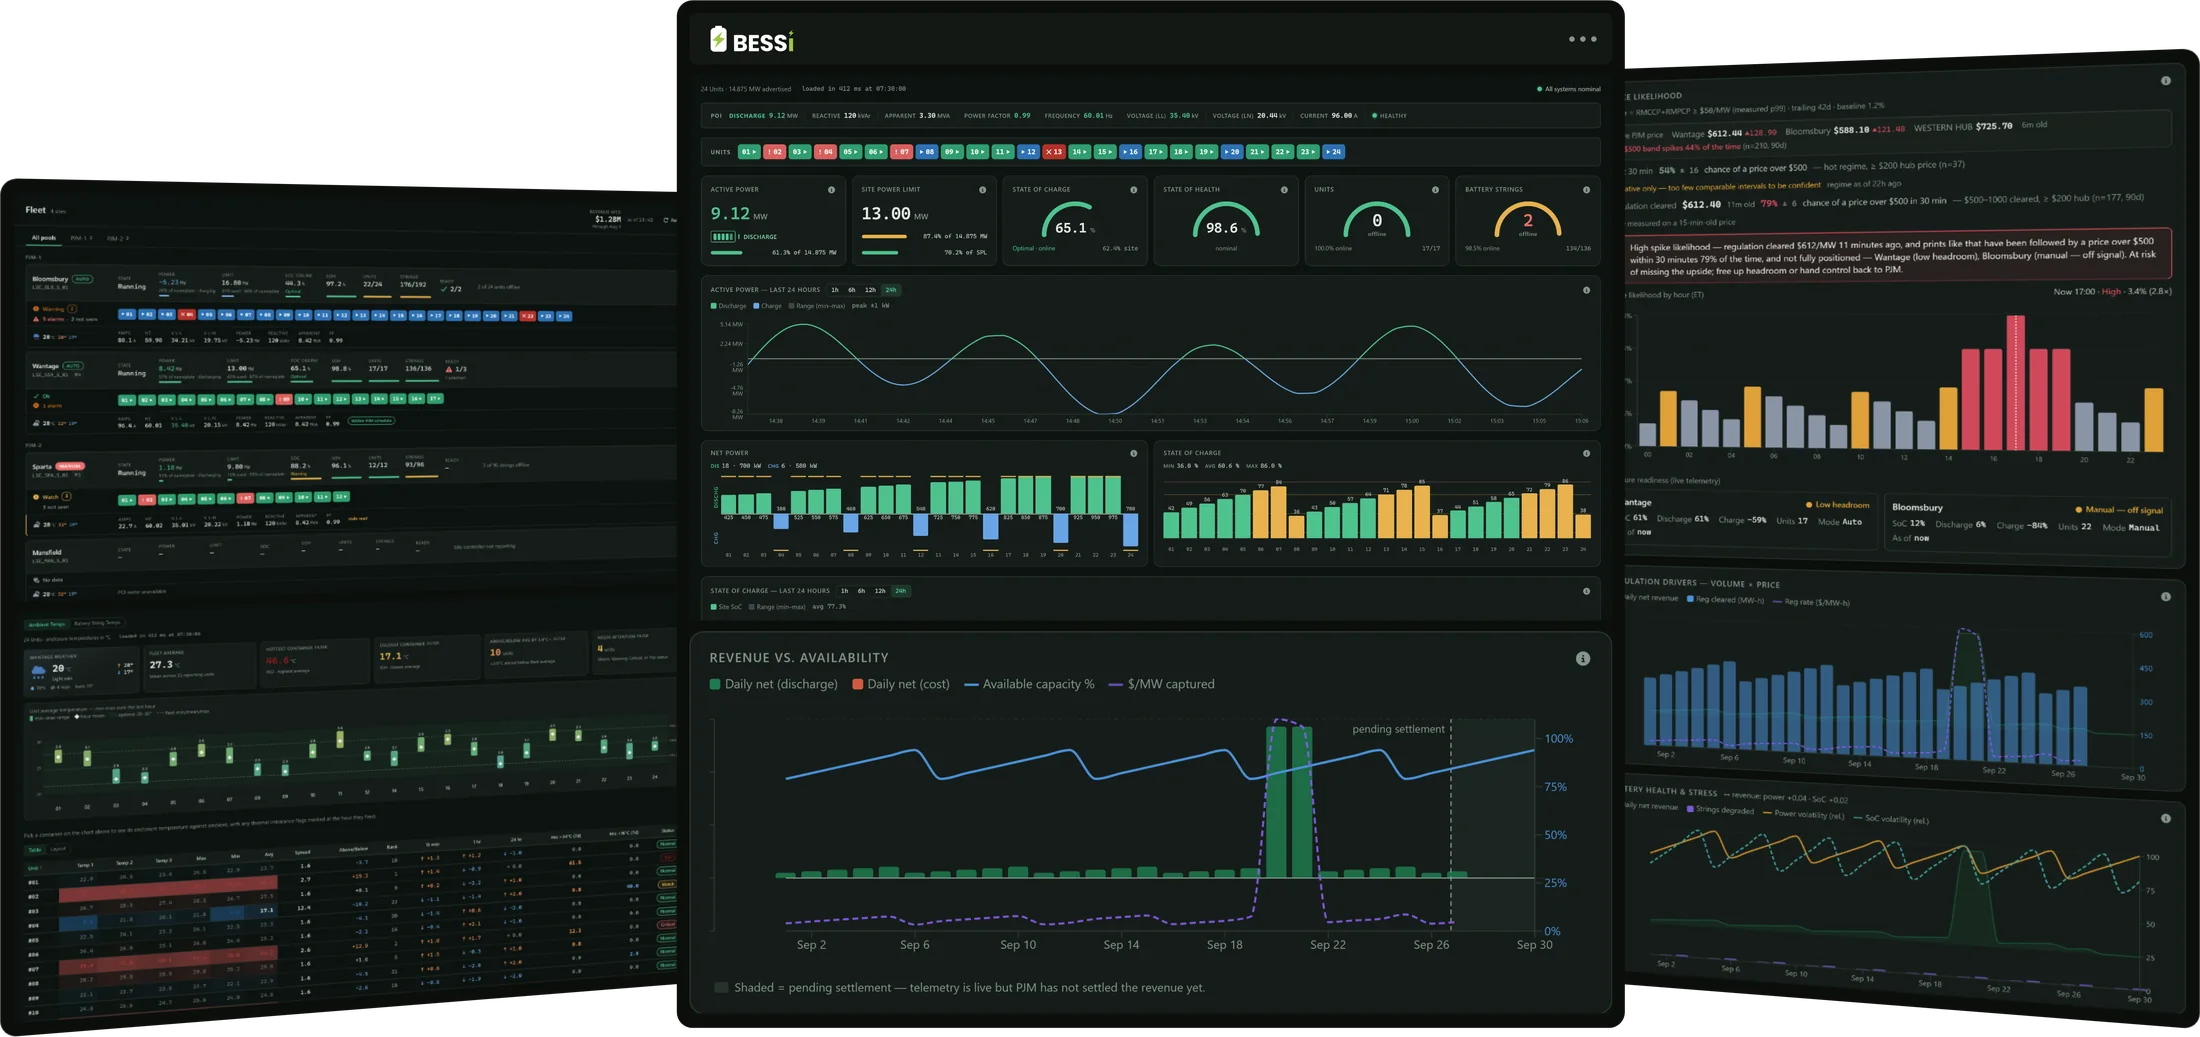
Fleet, site and market views — one read-only platform, from the whole fleet down to a single string.
Tell us about your fleetWatch the overviewMissed the booth demo? Take the tour.
The same films running on the monitors at booth C4782 — from fleet view down to a single string. Pick a chapter to jump straight to it.
- Tour chapters
-
- Each site's state, power, limit and charge
- Every container as a live chip
- Grid meter readings against the PJM schedule
-
- Live gauges for power, charge and health
- 24 hours of site power, charging and discharging
-
- Amps, volts, power and power factor, by phase
- Per-phase balance at the meter
- Power quality and a lifetime energy ledger
-
- Every container at a glance
- Strings, inverters and limits per container
- State of charge, string by string
-
- Ambient and battery-string temperatures, against the fleet
- Every container against the fleet band
- Thermal balance names the worst strings
-
- One banner: the single most urgent action
- Go out, trim or shed, priced per site
- Every signal on one 24-hour timeline
- Which way the grid is pushing, and what it pays
- The next 24 hours, spike by spike
-
- Every alarm, decoded and named
- Replay the trip, onset to the second
- Causes ranked, with every past match
-
- Commanded versus delivered, every divergence explained
- The hours most likely to spike
- Ask AI explains the chart in plain language
See it on your fleet.
A 30-minute walkthrough with your own sites on the table. Live dashboards, not slideware.